Research
The lab runs one pipeline and points it at two settings. Heterogeneous marine imagery and Earth observation data go in; habitat classifications, standardised biodiversity metrics, spatial analyses and mapped outputs come out, with provenance recorded and uncertainty stated. Everything below is either a component of that pipeline or an application of it.
The methods core
Automated marine image analysis. Classification and detection over image collections too large to annotate by hand — hundreds of thousands of frames from towed camera systems, and stereo-video transects in coastal water. Colour correction, georeferencing and quality screening are part of the chain, not an afterthought: AI-SCW for seafloor classification and FaunD-Fast for fauna detection are the released implementations.
Habitat classification. Assigning habitat classes to optical imagery with minimal manual annotation, correcting for the classification bias that arises from differences in image resolution and from imbalanced categories.
Standardised biodiversity metrics. Counts and identifications turned into indices that can be compared across surveys, sites and years rather than read only within one dataset.
Spatial analysis. Geostatistical interpolation, spatial autocorrelation and hotspot analysis, to get from observations along a survey line to a map of the area between them.
Uncertainty and reproducibility. Outputs are delivered as maps with stated uncertainty rather than a single headline number, and published with the data and code needed to reproduce them.
Coastal — blue carbon stock mapping
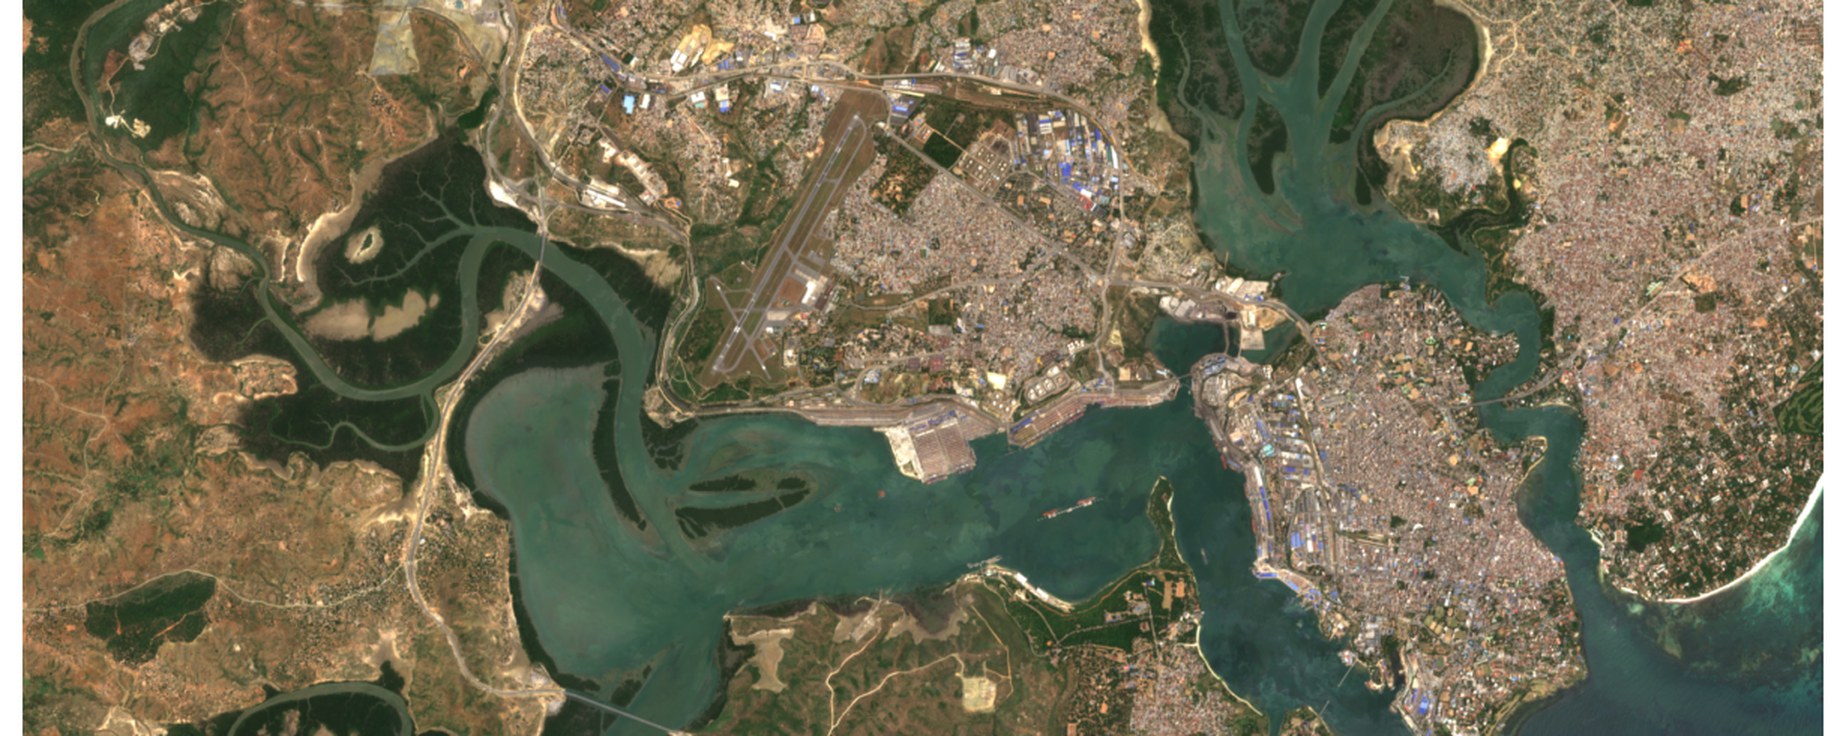
Estimating above- and below-ground carbon across mangrove extents by fusing Sentinel-2 optical imagery, NASA GEDI spaceborne LiDAR and field allometry with deep learning. Our first site is Mwache Creek in Mombasa, where 2,151 GEDI footprints constrain canopy structure across 2,890 hectares of mangrove forest. Outputs are structured against Verra VM0033 so they can support carbon project validation.
Coastal — Blue Biodiversity Integrity Index
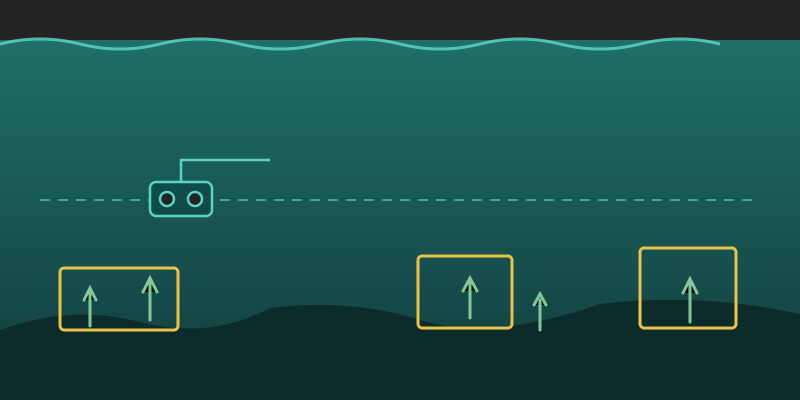
A carbon number says nothing about whether an ecosystem is alive and functioning. Blue-BII derives a biodiversity integrity index for blue carbon ecosystems from below-water stereo-video transects, using computer vision to identify and count organisms at a rate manual annotation cannot match. The index is designed to sit alongside carbon estimates in TNFD and GRI Biodiversity Standard reporting.
Deep sea — Deep-BII
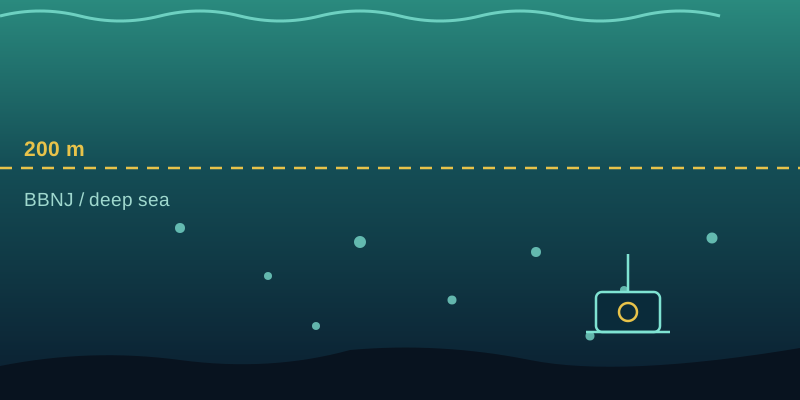
Extending the integrity index below 200 m, developed with the Ocean Discovery League’s 2026 Western Indian Ocean cohort. Deep-sea habitats are the least surveyed and least protected part of the ocean, and the BBNJ Treaty creates an immediate need for methods that can assess them from sparse imagery. It builds directly on the deep-sea image analysis described below.
Where the methods come from
The pipeline was built on the deep sea. Between 2022 and 2025 the lab’s director, then at GEOMAR Helmholtz Centre for Ocean Research Kiel, developed and published automated workflows for classifying seafloor imagery and detecting megabenthic fauna in the Clarion–Clipperton Zone in the Pacific, working with imagery collected by towed camera systems during RV SONNE cruises SO268/1 and SO268/2. The Pacific work was carried out within polymetallic-nodule exploration contract areas under the JPI Oceans MiningImpact project.
A 2025 study then applied both workflows together in the tropical Atlantic. That result matters more than a fourth paper: it showed the workflows transfer to a different ocean basin and a different geological setting without being rebuilt. That transferability is the reason the coastal work starts from a demonstrated method rather than from scratch. Full citations and DOIs are on Publications.
What is demonstrated is automated detection and classification of benthic organisms and substrates in deep-sea optical imagery, at survey scale, across two ocean basins. What is not yet demonstrated is the performance of these methods in shallow, turbid coastal water on Western Indian Ocean taxa. No coastal accuracy figure exists, and we do not claim one. That adaptation is the current work.
Field site